The Health dashboard shows whether Analytics and the services it relies on are working. This page explains it. It is useful to everyone, and especially when something is not processing as expected.
Reading the dashboard
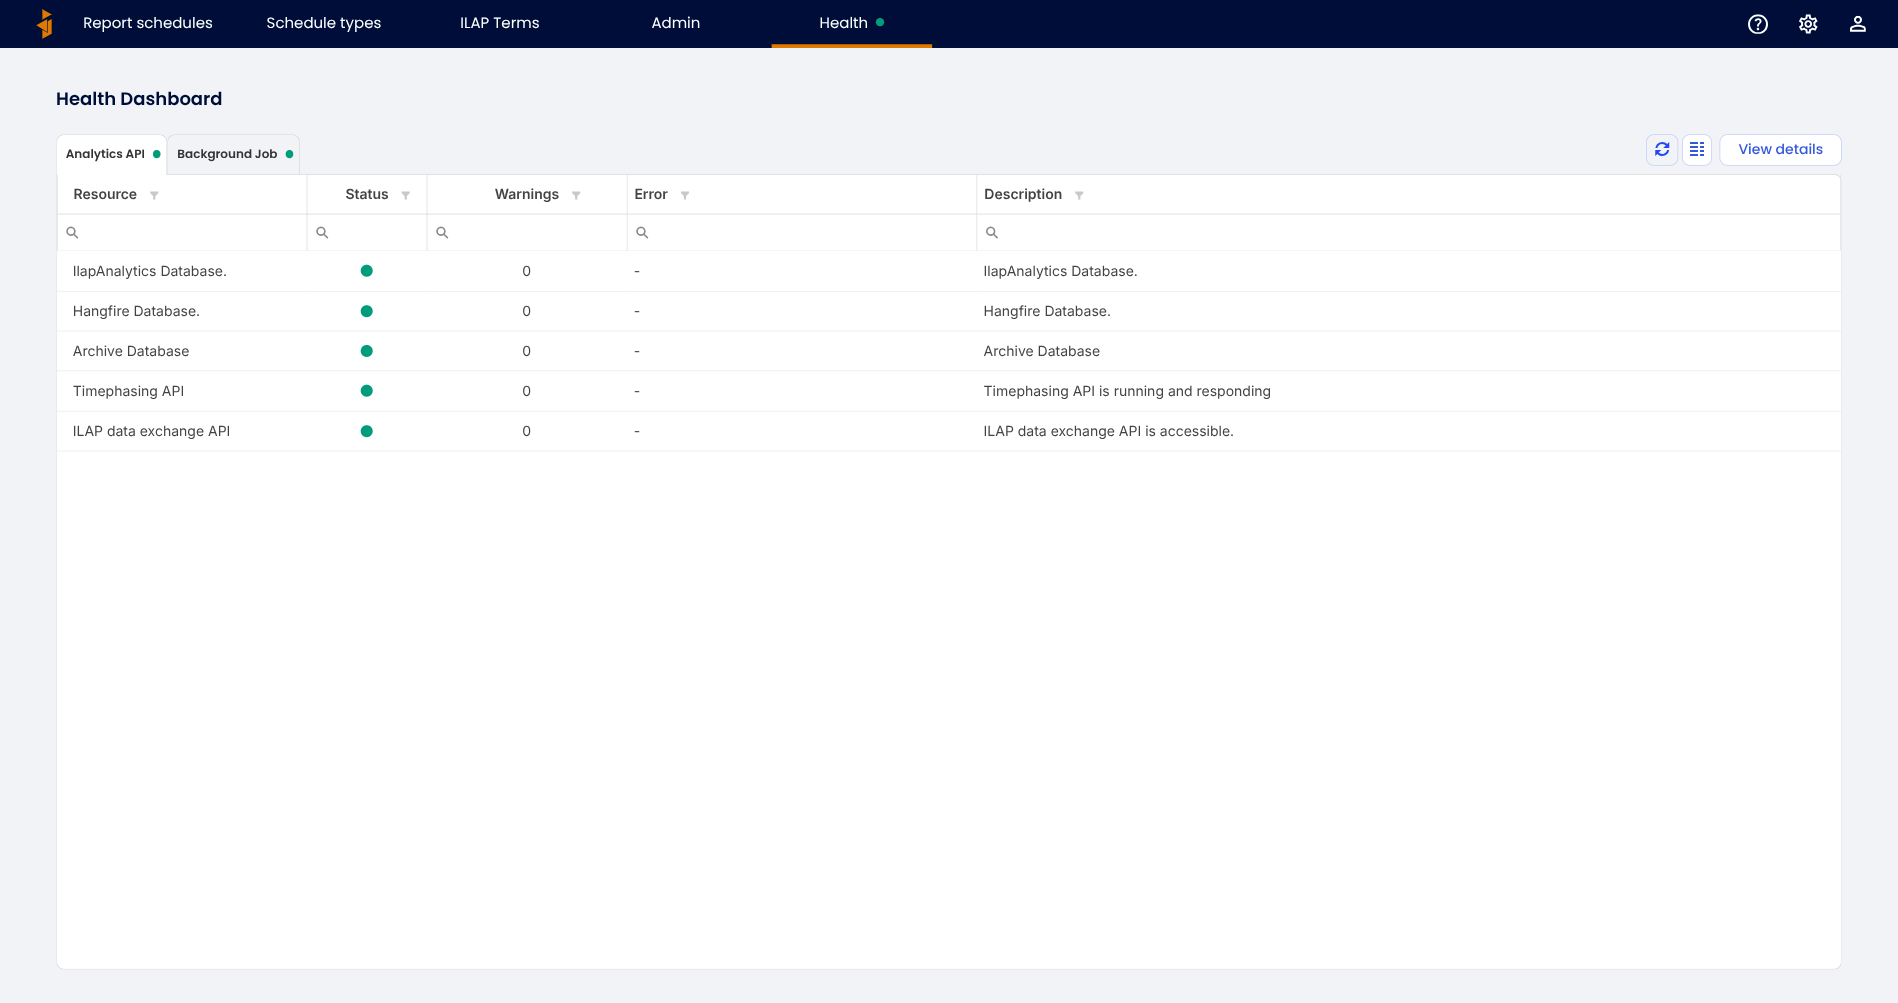
The small dot next to Health in the top menu gives an at-a-glance status. Open the dashboard for the detail, grouped by component:
- Analytics API — the service the web app and integrations talk to.
- Background Job — the service that runs imports, time-phasing, and archiving.
For each, a grid lists the resources it depends on and their status, warnings, errors, and a short description. Typical resources include the Analytics database, the Hangfire (background job) database, the archive database, the time-phasing service, and the ILAP Data Exchange API.
When something is unhealthy
If a resource shows a warning or error, imports or time-phasing may stall. Note which resource is affected and its message, then contact your IT team or Promineo support — the description usually points to the cause (for example a dependency that is unreachable). Use View details for more information.
Was this article helpful?
That’s Great!
Thank you for your feedback
Sorry! We couldn't be helpful
Thank you for your feedback
Feedback sent
We appreciate your effort and will try to fix the article