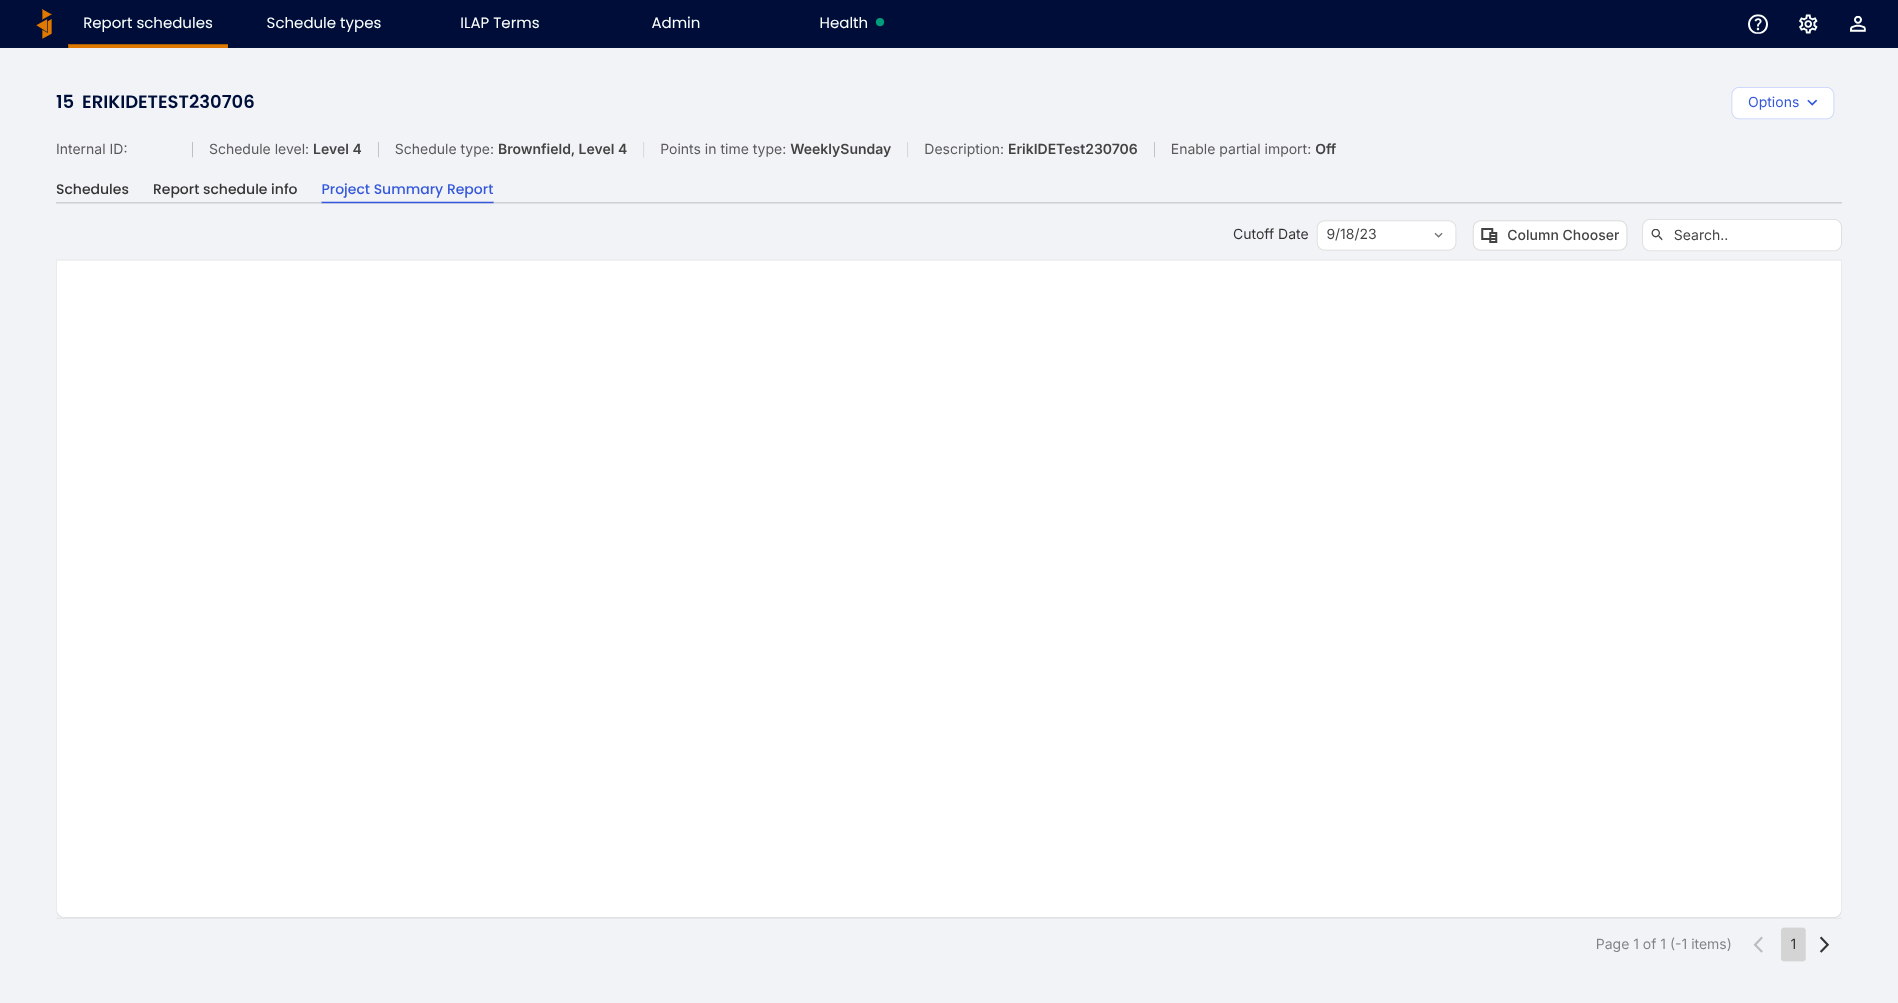
The Project Summary Report tab shows a report schedule's time-phased (periodized) data for a chosen cut-off date. This page explains it. It is written for planners and report technicians preparing figures for reporting.
What it shows
When a schedule is imported, Analytics spreads each activity's planned and actual work across calendar periods (this is time-phasing). The Project Summary Report presents that periodized result as a grid.
Using it
- Cut-off date — choose the cut-off to report against. The grid shows the data as at that date.
- Column Chooser — add or remove columns to shape the view.
- Search — filter the rows.
The periods are governed by the report schedule's points in time type (for example Daily or WeeklySunday) and the schedule type's time-phasing scope (Total, Remaining, or Total Minus Actuals). For pulling this data into Power BI, Microsoft Fabric, or another tool, see the API reference guides under Using Analytics → Analytics API.
Was this article helpful?
That’s Great!
Thank you for your feedback
Sorry! We couldn't be helpful
Thank you for your feedback
Feedback sent
We appreciate your effort and will try to fix the article